RSP Trade Benefits From Market Breadth And Sector Rotation
Dec 12, 2025 16:51:00 -0500 by JUSTIN NIELSEN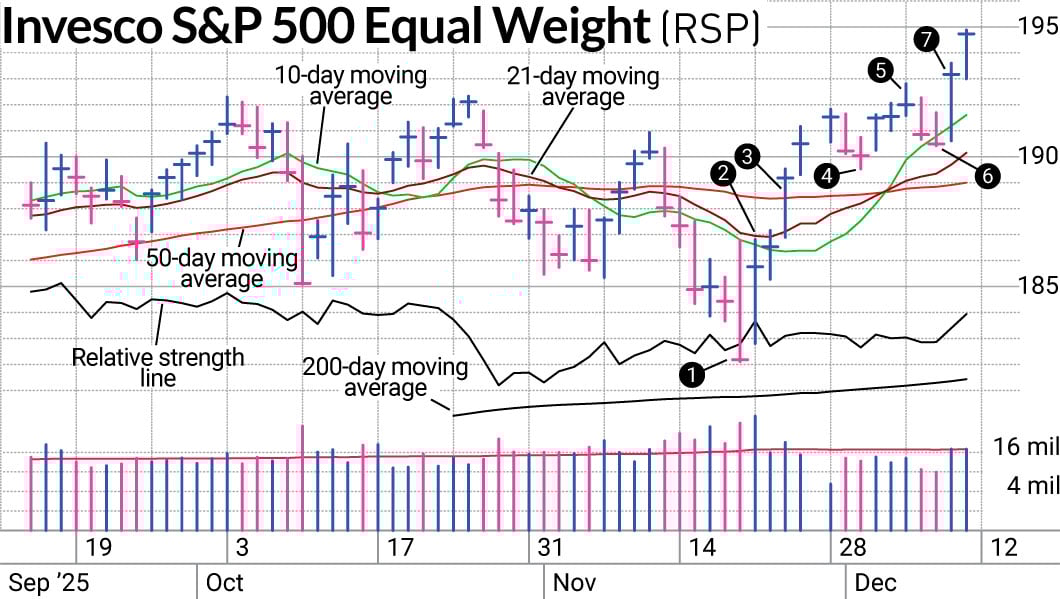
The last few years have been all about the “Magnificent 7.” Members of the growing number of trillion-dollar companies dominate the market-cap weighted indexes. At times, they’ve sucked the air out of the room and it hasn’t been worth looking at much else. Small-cap stocks were in a punishing downtrend since the rate-hike cycle started in 2022.
Could that be shifting? The Invesco S&P 500 Equal Weight ETF (RSP) and the recent performance of the Russell 2000 have certainly offered up the possibility.
A Different Measure Of Relative Strength
We’ve written a lot about the relative strength line in this column. For good reason. It’s one of the most useful indicators to identify potential winning trades. Watching where the bounces and breaks come for technical support and resistance levels is another indicator of relative strength.
On Nov. 20, the S&P 500 and Nasdaq composite got clobbered with losses of 1.6% and 2.2%, respectively. The equal-weighted S&P ETF fell just 1.2%, by contrast (1). The relative strength line popped up a bit even with RSP being down. Being down less makes you a relative strength winner even if you are still losing in absolute terms. That’s not too stunning on its own.
The next day is where things got interesting. While the S&P 500 and Nasdaq gained under a percent, the RSP trade easily doubled both in performance (2). Even better was how the chart looked. RSP actually challenged the Nov. 20 high and finished close to that level. The S&P 500 and Nasdaq were both still well in the lower part of the Nov. 20 trading range.
A couple days later when the S&P 500 and Nasdaq were finally closing near the Nov. 20 high, RSP was well above that level (3). Its low was already at that level, setting a solid area of potential support. The low was also nearly clearing its 21-day moving average line, setting it apart from the other indexes as well. Those elements of relative strength put the RSP trade on the SwingTrader list of Current Trades.
RSP Trade Hits New Highs
The RSP trade nearly got to new highs before a two-day pullback. The second day of the pullback was a little concerning (4). RSP was losing ground while the other indexes were up for the day. Our profit cushion afforded us some flexibility to hold it a little longer.
That was rewarded with another venture to new high territory by RSP (5). It briefly made a new high before retreating and closing low in its range that day.
We expected a pullback but unlike the last pullback, this pullback saw a breach of the 10-day line for RSP (6). The S&P 500 and Nasdaq composite both held above their 10-day lines. We took it as a sign to book the profit that we had in RSP while moving to more favorable areas.
One of the areas chosen that day was the iShares Russell 2000 ETF (IWM). So when RSP shot up 1.4% the next day (7), we didn’t have to bemoan our sell. Our move to the small-cap index also saw a 1.4% gain for the day. With AI taking a harder hit, RSP and IWM remain areas we are choosing to reduce the technology exposure to and go with what’s working.
More details on past trades are accessible to subscribers and trialists to SwingTrader. Free trials are available. Follow Nielsen on X, formerly known as Twitter, at @IBD_JNielsen.
YOU MAY ALSO LIKE:
Why This IBD Tool Simplifies The Search For Top Stocks
Learn How To Time The Market With IBD’s ETF Strategy
This Model Points To Inflows In Medical ETF
Looking For The Next Stock Market Winner? Start With These 3 Steps